
Introduction
Traffic data is the foundation of sound transportation planning. A road may have excellent pavement, adequate drainage, and good geometric design, yet still perform poorly if engineers do not understand how vehicles and people actually use it. Traffic surveys provide that missing picture by converting road-user activity into reliable engineering data.
Traffic Survey Methods are systematic techniques used to measure traffic volume, vehicle classification, speed, travel patterns, congestion, parking activity, pedestrian movement, and other characteristics of transportation systems. Engineers use this information for road design, pavement design, intersection improvement, traffic management, capacity analysis, economic evaluation, and highway maintenance planning.
A well-planned traffic survey can reveal peak-hour demand, heavy-vehicle percentages, directional flow, recurring congestion, unsafe movements, and changes in travel behavior. Poorly designed surveys can produce misleading results and eventually affect major infrastructure decisions.
This guide explains the major traffic survey methods used in highway and transportation engineering, including manual and automated techniques, traffic volume studies, speed surveys, origin-destination surveys, parking surveys, pedestrian counts, data analysis, field procedures, practical examples, common mistakes, and engineering best practices.
What Are Traffic Survey Methods?
Traffic survey methods are organized procedures for collecting, measuring, recording, and analyzing information about road traffic and transportation behavior.
The exact method depends on the engineering question. For example, an intersection capacity study may require classified turning-movement counts, while pavement design needs dependable traffic loading and heavy-vehicle data.
Traffic surveys commonly collect information such as:
- Traffic volume
- Vehicle classification
- Traffic composition
- Spot speed
- Travel time
- Delay
- Origin and destination
- Parking demand
- Pedestrian movement
- Bicycle movement
- Turning movements
- Queue length
- Traffic density
- Directional distribution
- Peak-hour characteristics
The objective is not simply to count vehicles. Engineers must collect the right data at the right location and during representative periods.
Why Traffic Surveys Are Important
Traffic survey data supports decisions throughout the highway project life cycle.
During planning, it helps identify transportation demand and justify improvements. In processing of design, engineers use it to estimate capacity and determine appropriate geometric and pavement parameters. During construction, surveys can support traffic management plans. After completion, repeated surveys help evaluate whether the facility is performing as expected.
Reliable traffic data can also support:
- Highway widening studies
- Intersection redesign
- Traffic signal timing
- Roundabout evaluation
- Pavement thickness design
- Road safety improvements
- Public transport planning
- Economic feasibility studies
- Parking management
- Future traffic forecasting
In professional practice, survey quality matters as much as survey quantity. Ten days of poorly controlled data may be less useful than two carefully selected representative survey days.
Major Types of Traffic Survey Methods
Transportation engineers use several traffic survey techniques because no single method can describe every aspect of traffic behavior.
The principal methods include traffic volume surveys, speed studies, travel-time surveys, origin-destination studies, parking surveys, pedestrian surveys, and classified traffic counts.


Traffic Volume Survey
A traffic volume survey measures the number of vehicles passing a particular point or section of roadway during a specified period.
Traffic volume may be reported as vehicles per hour, vehicles per day, or vehicles per year.
A basic traffic volume expression is:
Traffic Volume = Number of Vehicles Observed / Survey Duration
For example, if 2,400 vehicles pass a survey station during four hours:
Traffic Volume = 2,400 / 4 = 600 vehicles/hour
Volume surveys are fundamental for capacity analysis, road classification, intersection design, lane requirements, and traffic forecasting.
Classified Traffic Count
A classified traffic count separates vehicles into categories such as:
- Motorcycles
- Cars
- Pickups
- Vans
- Buses
- Two-axle trucks
- Multi-axle trucks
- Trailers
- Other heavy vehicles
Vehicle classification becomes particularly important when engineers evaluate pavement loading because heavy vehicles contribute disproportionately to pavement damage.
The classification system should match the project’s requirements and the relevant road authority’s standards.
Turning Movement Count
A turning movement count records vehicles entering an intersection and identifies whether they:
- Turn left
- Travel through
- Turn right
Engineers often conduct turning counts separately for each approach.
The resulting data supports:
- Signal timing
- Lane allocation
- Intersection capacity analysis
- Channelization
- Roundabout design
- Right-turn and left-turn lane warrants
- Queue analysis
For a busy urban intersection, a 15-minute interval count can reveal changes in demand that an hourly total may hide.
Directional Traffic Survey
Directional distribution measures how traffic divides between opposing directions.
For example, during the morning peak, 70% of traffic may travel toward a commercial center while only 30% travels in the opposite direction. The evening pattern may reverse.
Directional data helps engineers evaluate lane requirements, median design, reversible lanes, intersection operation, and peak-period traffic management.
Traffic Speed Survey Methods
Speed studies determine how fast vehicles travel under actual roadway conditions.
Speed information is essential for geometric design, safety analysis, speed-limit evaluation, sight-distance assessment, and traffic management.


Spot Speed Study
A spot speed study measures the speed of individual vehicles at a specific location.
Common equipment includes:
- Radar speed meters
- Lidar devices
- Pneumatic tubes
- Video systems
- Automatic traffic counters
The collected speeds can be arranged into a frequency distribution.
Important statistical measures include:
- Mean speed
- Median speed
- Mode
- 15th percentile speed
- 50th percentile speed
- 85th percentile speed
- Standard deviation
The 85th percentile speed is frequently examined in traffic engineering because it represents the speed at or below which approximately 85% of observed vehicles travel under free-flow conditions. Its application should always follow the applicable local regulations and engineering guidance.
Running Speed and Journey Speed
Running speed considers the time a vehicle is actually moving.
Journey speed considers the complete travel time, including stops and delays.
The basic equation is:
Speed = Distance / Time
Suppose a vehicle covers 12 km in 20 minutes:
20 minutes = 0.333 hour
Journey Speed = 12 / 0.333 ≈ 36 km/h
This distinction becomes important on congested urban corridors where traffic signals, queues, pedestrian crossings, and roadside activity create substantial delays.
Travel Time and Delay Survey
A travel-time survey measures how long vehicles take to travel between selected points.
The survey may identify:
- Total journey time
- Running time
- Stopped delay
- Intersection delay
- Queue delay
- Recurring congestion
- Bottleneck locations
One practical field technique is the floating car method. A survey vehicle attempts to travel with the traffic stream while recording travel time, stops, delays, and operating conditions.
Travel-time data helps engineers compare alternative routes and evaluate corridor performance.
Basic Delay Calculation
A simplified delay calculation can be expressed as:
Delay = Actual Travel Time − Ideal or Free-Flow Travel Time
For example, if a 10 km corridor normally takes 12 minutes during free flow but requires 22 minutes during peak conditions:
Delay = 22 − 12 = 10 minutes
Repeated surveys can show whether congestion is increasing and where intervention would provide the greatest benefit.
Origin-Destination Survey
An origin-destination, or O-D, survey identifies where trips begin and where they end.
It answers questions such as:
- Where are travelers coming from?
- Where are they going?
- Which routes do they use?
- What proportion of trips are local?
- How much traffic is through traffic?
- What destinations generate the greatest demand?


Common O-D survey techniques include:
- Roadside interviews
- Questionnaire surveys
- License-plate matching
- Household travel surveys
- GPS-based travel data
- Mobile-device-based analysis
- Public transport passenger surveys
Roadside Interview Survey
In a roadside interview, selected vehicles are stopped and drivers are asked questions about their journey.
Typical questions may cover:
- Origin
- Destination
- Trip purpose
- Vehicle type
- Route
- Frequency of travel
Safety and traffic disruption must receive serious attention. Survey teams should follow an approved traffic-control plan and avoid creating hazardous stopping conditions.
License Plate Matching
License plate surveys record vehicle registration numbers at multiple stations. Matching observations between locations can help estimate travel patterns and route choices.
Modern projects may use video analytics or automated recognition systems, subject to applicable privacy laws and project requirements.
Parking Survey Methods
Parking studies evaluate how vehicles use available parking spaces.
They are important in commercial areas, business districts, airports, hospitals, educational campuses, transport terminals, and mixed-use developments.


Common parking survey methods include:
Parking Accumulation Survey
Parking accumulation measures the number of vehicles parked at a particular time.
A time-based observation might be performed every 15 or 30 minutes.
Parking Occupancy Survey
Occupancy indicates how much of the available parking capacity is being used.
Parking Occupancy (%) = Occupied Spaces / Available Spaces × 100
If 180 out of 240 spaces are occupied:
Occupancy = 180 / 240 × 100 = 75%
Parking Duration Study
Parking duration measures how long vehicles remain parked.
This helps distinguish short-term users from long-term users and can identify whether employees are occupying spaces needed by customers.
Parking Turnover
Parking Turnover = Number of Vehicles Parked / Number of Parking Spaces
A high turnover rate generally indicates frequent use, while a low rate may indicate long parking durations.
Pedestrian and Bicycle Traffic Surveys
Traffic surveys should not focus exclusively on motor vehicles.
Pedestrian and bicycle movement can strongly influence intersection design, crossing facilities, sidewalks, cycle tracks, transit access, and road safety.
Engineers may record:
- Pedestrians per hour
- Bicycle volume
- Crossing locations
- Direction of movement
- Age or user categories when relevant and ethically appropriate
- Peak pedestrian periods
- Conflicts with vehicles
- Crossing delays
At schools, markets, transit stations, and commercial streets, pedestrian demand may peak at different times from vehicular traffic.
A road improvement that increases vehicle capacity but creates unsafe pedestrian crossings may not represent a successful transportation solution.
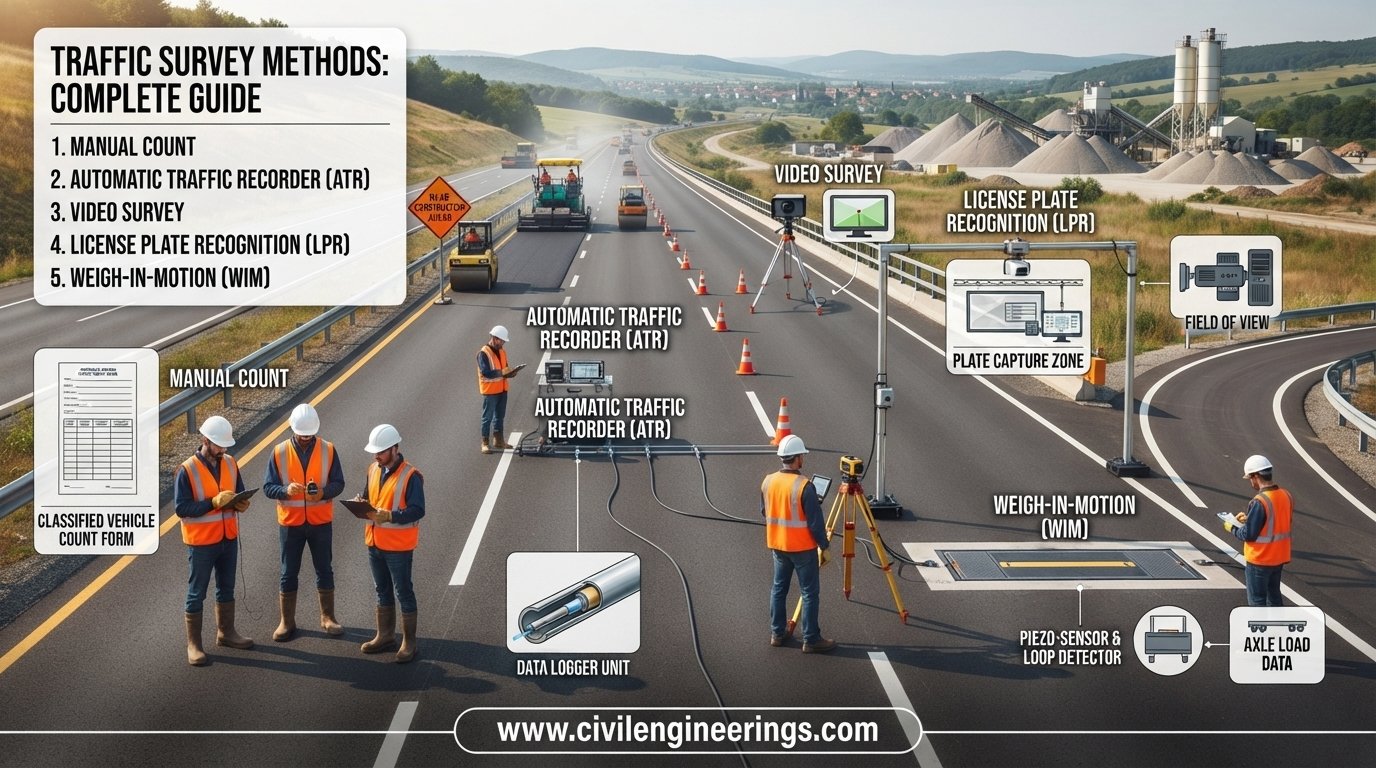
Manual Traffic Survey Methods
Manual counting remains useful when traffic movements are complex or when classification detail is required.
Surveyors normally use tally sheets, field forms, counters, tablets, or specialized software.
Manual methods work particularly well for:
- Turning movement counts
- Vehicle classification
- Pedestrian counts
- Short-duration intersection studies
- Unusual traffic conditions
- Locations where automated equipment cannot be installed safely
Advantages of Manual Surveys
Manual surveys offer flexibility. A trained observer can distinguish unusual vehicle movements, construction traffic, illegal turns, pedestrian conflicts, and other details that simple automatic counters may miss.
Their main limitations include observer fatigue, human error, weather exposure, and limited duration.
For long surveys, teams should use shift rotation and clear counting instructions.
Automatic Traffic Survey Methods
Automatic traffic surveys use electronic equipment to collect traffic information with reduced dependence on field observers.
Typical technologies include:
- Inductive loop detectors
- Pneumatic tubes
- Radar detectors
- Video detection
- Infrared sensors
- Bluetooth or wireless tracking systems
- Automatic traffic counters
Automatic systems can provide continuous data over many hours or days.
They are particularly useful for determining daily and weekly traffic patterns, peak periods, vehicle classification, speed distributions, and seasonal variation.
However, equipment calibration, installation quality, detection accuracy, power supply, weather conditions, and data validation must be carefully controlled.
How to Conduct a Traffic Survey Step by Step
A professional traffic survey begins before anyone reaches the roadway.
Define the Survey Objective
First establish exactly what the project needs to know.
For example:
“Determine weekday peak-hour classified traffic and turning movements at the intersection to evaluate signalized intersection capacity.”
A precise objective prevents unnecessary data collection.
Select Survey Location
The location should represent the traffic condition being investigated.
Consider:
- Road hierarchy
- Intersection influence
- Nearby access points
- Bus stops
- Schools
- Markets
- Industrial entrances
- Construction activity
- Seasonal conditions
Select Survey Period
Survey timing should reflect the study objective.
Typical periods may include:
- Morning peak
- Midday
- Evening peak
- Nighttime
- Full 24-hour period
- Weekday
- Weekend
- Special event period
Engineers should avoid unusual days unless the unusual condition itself is the subject of the study.
Prepare Survey Forms
The field sheet should clearly identify:
- Date
- Location
- Weather
- Survey direction
- Time interval
- Vehicle categories
- Observer name or identification
- Equipment used
- Special observations
Digital forms can reduce transcription errors, but field staff still need a backup procedure.
Conduct the Field Survey
Surveyors should arrive early, inspect the site, confirm visibility, verify equipment, and identify safe observation positions.
Traffic control personnel should be used where necessary.
The team should record unusual events such as:
- Accidents
- Road closures
- Police activity
- Vehicle breakdowns
- Heavy rainfall
- Construction interference
- Special events
- Temporary diversions
These events may affect data validity.
Check and Validate the Data
Raw traffic data should never go directly into final design calculations without checking.
Validation should look for:
- Missing intervals
- Impossible values
- Sudden unexplained spikes
- Duplicate records
- Incorrect vehicle classifications
- Directional imbalance
- Equipment failures
- Observer inconsistencies
A short field note explaining an abnormal observation can be extremely valuable months later when engineers revisit the dataset.
Traffic Survey Data Analysis
Once the field data has been collected, engineers convert observations into useful indicators.
Peak Hour Factor
The Peak Hour Factor, or PHF, indicates how evenly traffic is distributed during the peak hour.
A commonly used equation is:
PHF = Peak Hour Volume / (4 × Peak 15-Minute Volume)
Suppose the peak-hour volume is 1,200 vehicles and the highest 15-minute volume is 340 vehicles:
PHF = 1,200 / (4 × 340)
PHF = 1,200 / 1,360 ≈ 0.88
A lower PHF indicates a stronger concentration of traffic within the peak hour.
Annual Average Daily Traffic
AADT represents the average number of vehicles traveling along a roadway per day over a year.
It is commonly derived from traffic counts using appropriate adjustment factors when continuous annual data is unavailable.
Engineers may apply seasonal, day-of-week, and other correction factors depending on the methodology and available datasets.
AADT is widely used in highway planning, road classification, traffic forecasting, and pavement-related studies.
Traffic Survey Methods for Pavement Design
Traffic surveys play a critical role in pavement engineering because traffic loading affects pavement deterioration.
For flexible pavement, engineers are particularly interested in heavy commercial vehicles and axle loading.
Important traffic inputs can include:
- Commercial vehicle volume
- Axle configuration
- Vehicle growth rate
- Directional distribution
- Lane distribution
- Design period
- Equivalent axle loading
A simplified compound traffic growth equation is:
Future Traffic = Present Traffic × (1 + r)ⁿ
Where:
- r = annual growth rate
- n = number of years
If present traffic is 8,000 vehicles/day, annual growth is 5%, and the design horizon is 10 years:
Future Traffic = 8,000 × (1.05)¹⁰
This produces approximately 13,031 vehicles/day.
Actual pavement design requires more detailed traffic loading procedures and should follow the selected pavement design methodology.
Traffic Survey Standards and Engineering References
Traffic survey procedures should align with the requirements of the project authority and applicable standards.
Depending on the location and project type, engineers may consult guidance from organizations such as:
- IRC — Indian Roads Congress
- AASHTO — American Association of State Highway and Transportation Officials
- ICE — Institution of Civil Engineers
- National highway agencies
- Local transportation departments
- Municipal traffic authorities
IRC publications are widely referenced across South Asian highway projects, while AASHTO guidance is extensively used in transportation and pavement engineering practice in the United States and internationally.
These organizations provide guidance covering traffic studies, geometric design, capacity, pavement design, transportation planning, and related engineering practices. Engineers should always use the edition and standards specified by the project authority rather than relying on an outdated document.
Common Mistakes in Traffic Surveys
Even experienced teams can produce weak results if survey planning is poor.
Choosing an Unrepresentative Day
A holiday, special event, strike, road closure, or abnormal weather event can distort traffic demand.
Using Too Short a Survey Period
A two-hour count may be insufficient for a project requiring daily or seasonal traffic characteristics.
Ignoring Vehicle Classification
Total traffic volume alone does not describe pavement loading or heavy-vehicle demand.
Poor Observer Position
If surveyors cannot see all movements clearly, turning counts and classifications become unreliable.
Failing to Record Abnormal Events
Without field notes, analysts may interpret an accident-related traffic reduction as a normal traffic pattern.
Not Calibrating Equipment
Automatic counters can produce systematic errors if detection zones or classification settings are incorrect.
Treating All Traffic Data as Equal
Traffic data must be evaluated for accuracy, consistency, representativeness, and relevance to the engineering decision.
Practical Recommendations for Civil Engineering Students
Students can gain strong practical skills by treating traffic surveys as an engineering investigation rather than simply a counting exercise.
Start by learning basic traffic-flow concepts such as volume, speed, density, headway, spacing, capacity, and level of service.
During fieldwork:
- Prepare the counting sheet before arriving.
- Clearly define vehicle categories.
- Use consistent time intervals.
- Record unusual traffic conditions.
- Cross-check manual counts.
- Plot traffic variation by time.
- Calculate basic statistical measures.
- Compare morning and evening patterns.
- Explain what the data means from an engineering perspective.
A good student report should not merely state that “1,500 vehicles were counted.” It should explain when, where, under what conditions, how the vehicles were classified, and what the result means for the roadway.
Practical Recommendations for Highway Engineers and Consultants
Professional engineers should connect survey methodology directly to the design decision.
Before the survey, prepare a written data collection plan. Define the objective, required accuracy, survey duration, equipment, locations, staffing, safety controls, and quality-control procedure.
For major highway projects, consider combining multiple methods. A classified traffic count can be supplemented by speed data, travel-time observations, axle information, and O-D analysis.
Use automated equipment for continuous monitoring where appropriate, but validate automated observations through manual checks.
When analyzing historical data, investigate abrupt changes instead of assuming that every change represents real traffic growth. Road openings, commercial development, construction, fuel-price changes, public transport changes, and network diversions can all influence traffic.
Most importantly, document assumptions. Future engineers should be able to understand how the survey data was collected and how it entered the design process.
Practical Recommendations for Contractors
Contractors may encounter traffic surveys during temporary traffic management, construction planning, diversion design, and work-zone studies.
Before starting work near live traffic, verify existing traffic conditions and identify peak periods. Construction access should avoid unnecessary conflict with major traffic movements.
For temporary diversions, monitor traffic after implementation. A route that appears adequate on paper may develop queues once drivers begin using it.
Contractors should also maintain records of unusual traffic conditions, complaints, incidents, and changes in traffic behavior. These records can help project teams adjust traffic-control measures.
Role of Technology in Modern Traffic Surveys
Traffic surveying is increasingly moving from manual observation toward integrated digital data collection.
Modern systems can combine:
- Video analytics
- Artificial intelligence
- Radar detection
- GPS data
- Connected vehicle information
- Geographic information systems
- Cloud-based dashboards
- Automated vehicle classification
- Real-time traffic monitoring
Artificial intelligence can identify vehicles, classify movements, estimate queues, and detect traffic events from video streams.
However, technology does not eliminate engineering judgment. A sophisticated sensor can still produce poor results if it is installed incorrectly or used at an unsuitable location.
The best approach combines reliable technology with sound survey design, field verification, and engineering interpretation.
Final Checklist for a Traffic Survey
Before accepting survey results, the project team should verify:
- Survey objective clearly defined
- Appropriate locations selected
- Representative survey periods selected
- Vehicle categories clearly defined
- Surveyors properly trained
- Equipment checked and calibrated
- Traffic safety arrangements provided
- Weather and unusual events recorded
- Data checked for missing intervals
- Manual and automated observations cross-checked where practical
- Peak-hour conditions identified
- Heavy-vehicle data reviewed
- Calculations independently checked
- Assumptions documented
- Final dataset securely archived
FAQs About Traffic Survey Methods
What are traffic survey methods?
Traffic survey methods are systematic techniques used to collect information about vehicle movement, speed, volume, classification, travel time, parking, pedestrian activity, origin-destination patterns, and other transportation characteristics.
Why are traffic surveys important in highway engineering?
Traffic surveys provide the data needed for road planning, geometric design, pavement design, capacity analysis, intersection improvement, traffic forecasting, safety assessment, and transportation management.
What is the most common traffic survey?
Traffic volume counting is one of the most common traffic surveys. Engineers frequently combine it with vehicle classification and turning-movement counts depending on the project requirements.
What is a classified traffic count?
A classified traffic count separates vehicles into categories such as cars, motorcycles, buses, trucks, and trailers. It provides more useful information than a simple total vehicle count.
What is a spot speed survey?
A spot speed survey measures individual vehicle speeds at a particular location. Engineers use the results to understand operating speeds and support roadway safety and design decisions.
What is an origin-destination survey?
An origin-destination survey determines where trips start and finish. It helps transportation planners understand travel patterns, route choices, trip purposes, and traffic distribution.
How long should a traffic survey be conducted?
There is no universal duration. The required period depends on the study objective. A short intersection count may require only several hours, while traffic planning and forecasting studies may require 24-hour, multi-day, seasonal, or continuous observations.
What is Peak Hour Factor?
Peak Hour Factor measures how evenly traffic is distributed within the peak hour. It is commonly calculated using peak-hour volume and the highest 15-minute traffic volume.
Are automatic traffic counters better than manual counting?
Neither method is universally better. Automatic counters are excellent for continuous data collection, while trained observers can capture complex movements and detailed classifications. Combining both can provide stronger quality control.
What equipment is used for traffic surveys?
Common equipment includes manual tally sheets, electronic counters, radar meters, lidar devices, pneumatic tubes, video cameras, inductive loops, automatic traffic counters, GPS devices, and traffic-monitoring software.
Conclusion
Reliable traffic information is the starting point for better transportation decisions. Traffic Survey Methods give civil engineers, highway consultants, planners, contractors, and government agencies a structured way to understand how roads actually operate.
From basic traffic volume counts to classified surveys, speed studies, travel-time analysis, O-D surveys, parking studies, pedestrian counts, and automated monitoring, each method answers a different engineering question. Selecting the correct method is therefore more important than simply collecting large quantities of data.
Good practice begins with a clearly defined objective. Engineers then select representative locations, suitable survey periods, appropriate equipment, trained personnel, and effective quality-control procedures. The collected information should be checked, analyzed, and interpreted before it influences design decisions.
Standards and guidance from organizations such as IRC, AASHTO, and ICE can provide a useful technical framework, but project-specific requirements and local authority procedures must always govern the final methodology.
For students, traffic surveys provide valuable field experience. For professionals, they provide the evidence needed to design safer, more efficient, and more economical transportation infrastructure.
