
Introduction
Soil forms the foundation of every road, highway, bridge, and building. Engineers must understand how soil behaves under different moisture conditions before they design a safe and durable structure. Among the most important laboratory tests in geotechnical engineering, Atterberg Limits provide valuable information about the consistency, plasticity, and workability of fine-grained soils.
Road engineers use Atterberg Limits to classify soils, evaluate subgrade quality, estimate construction suitability, and predict engineering behavior during seasonal moisture changes. These limits help identify soils that may expand, shrink, crack, or lose strength when exposed to water. Without this knowledge, pavement failures, uneven settlements, and excessive maintenance costs become much more likely.
Whether you are a civil engineer, highway designer, contractor, or engineering student, understanding Atterberg Limits is essential for making informed decisions during site investigations and pavement design. This guide explains the concept, engineering principles, testing methods, and practical applications in simple yet technically accurate language.
What Are Atterberg Limits?
Atterberg Limits are the moisture content boundaries that define how fine-grained soils change from one physical state to another as their water content changes.
Fine-grained soils such as clay and silt do not behave the same way at all moisture levels. As water content increases, the soil gradually changes from a hard solid into a semi-solid, then a plastic material, and finally a liquid-like mass.
These transition points are known as the Atterberg Limits.
The three principal limits are:
- Liquid Limit (LL)
- Plastic Limit (PL)
- Shrinkage Limit (SL)
Engineers use these values to classify soils, assess plasticity, estimate compressibility, and evaluate suitability for highway embankments, foundations, and pavement subgrades.
History of Atterberg Limits
The concept originated in the early twentieth century when Swedish agricultural scientist Albert Atterberg studied the consistency of clay soils. His work established moisture content boundaries that describe changes in soil behavior.
Later, geotechnical engineer Arthur Casagrande refined the testing procedures and developed the standardized Liquid Limit apparatus that remains widely used today.
Today, Atterberg Limits form a fundamental part of geotechnical investigations around the world and appear in most national and international soil testing standards.
Why Atterberg Limits Matter in Road Engineering
Every highway pavement transfers vehicle loads to the underlying soil. If the subgrade loses strength because of moisture changes, the pavement may crack, settle, or develop ruts.
Atterberg Limits help engineers understand how sensitive a soil is to water.
Importance in Highway Engineering
Engineers use Atterberg Limits to:
- Classify fine-grained soils.
- Evaluate subgrade performance.
- Select suitable construction materials.
- Predict shrinkage and swelling.
- Design pavement thickness.
- Assess embankment stability.
- Improve compaction quality.
- Estimate drainage requirements.
Practical Application
Suppose a proposed highway passes through an area containing highly plastic clay. Laboratory testing shows a very high Liquid Limit and Plasticity Index.
Instead of using the natural soil directly, engineers may:
- Stabilize the soil with lime or cement.
- Replace unsuitable material.
- Increase pavement thickness.
- Improve drainage around the roadway.
These measures significantly improve pavement performance and reduce long-term maintenance costs.
Types of Atterberg Limits
The three Atterberg Limits represent different moisture content boundaries that define changes in soil consistency.
1. Liquid Limit (LL)
The Liquid Limit (LL) represents the moisture content at which soil changes from a plastic state to a liquid state.
Above the Liquid Limit, soil behaves almost like a viscous fluid and cannot support significant loads.
Characteristics
- High moisture content.
- Very low shear strength.
- Large deformation under loading.
- Difficult to compact.
Engineering Significance
A high Liquid Limit often indicates:
- Highly plastic clay.
- Greater compressibility.
- Higher swelling potential.
- Increased moisture sensitivity.
Typical Liquid Limit Ranges
| Soil Type | Liquid Limit |
|---|---|
| Sand | Not Applicable |
| Silt | 20–40% |
| Lean Clay | 30–50% |
| Fat Clay | Above 50% |
Higher Liquid Limits generally indicate greater engineering challenges during construction.
2. Plastic Limit (PL)
The Plastic Limit (PL) is the moisture content at which soil changes from a semi-solid state to a plastic state.
At this moisture level, soil can be molded without cracking.
Field Observation
During the laboratory test, the soil is rolled into threads approximately 3 mm in diameter.
When the thread begins to crumble at this diameter, the corresponding moisture content represents the Plastic Limit.
Engineering Importance
Plastic Limit helps engineers determine:
- Suitable compaction moisture.
- Soil workability.
- Construction suitability.
- Plasticity characteristics.
Soils with moderate Plastic Limits generally provide better construction performance than highly plastic soils.
3. Shrinkage Limit (SL)
The Shrinkage Limit (SL) is the moisture content below which further drying no longer causes a reduction in soil volume.
Above this limit, soil continues to shrink as it loses water.
Below this limit, only moisture decreases while the soil volume remains essentially constant.
Engineering Importance
Shrinkage Limit helps evaluate:
- Volume stability.
- Crack formation.
- Pavement performance.
- Foundation behavior.
Highly expansive clays usually have low Shrinkage Limits and require special engineering treatment.
Plasticity Index (PI)
The Plasticity Index (PI) measures the range of moisture content over which soil remains plastic.
It is calculated using the following relationship:
Plasticity Index = Liquid Limit − Plastic Limit
PI = LL − PL
Interpretation
| Plasticity Index | Soil Behavior |
|---|---|
| 0–5 | Non-plastic to slightly plastic |
| 5–15 | Low plasticity |
| 15–30 | Medium plasticity |
| Above 30 | High plasticity |
Engineering Significance
A higher Plasticity Index usually indicates:
- Greater swelling potential.
- Increased shrinkage.
- Lower bearing capacity during wet conditions.
- Higher risk of pavement deformation.
Engineers often use PI together with CBR and compaction test results to assess subgrade quality.
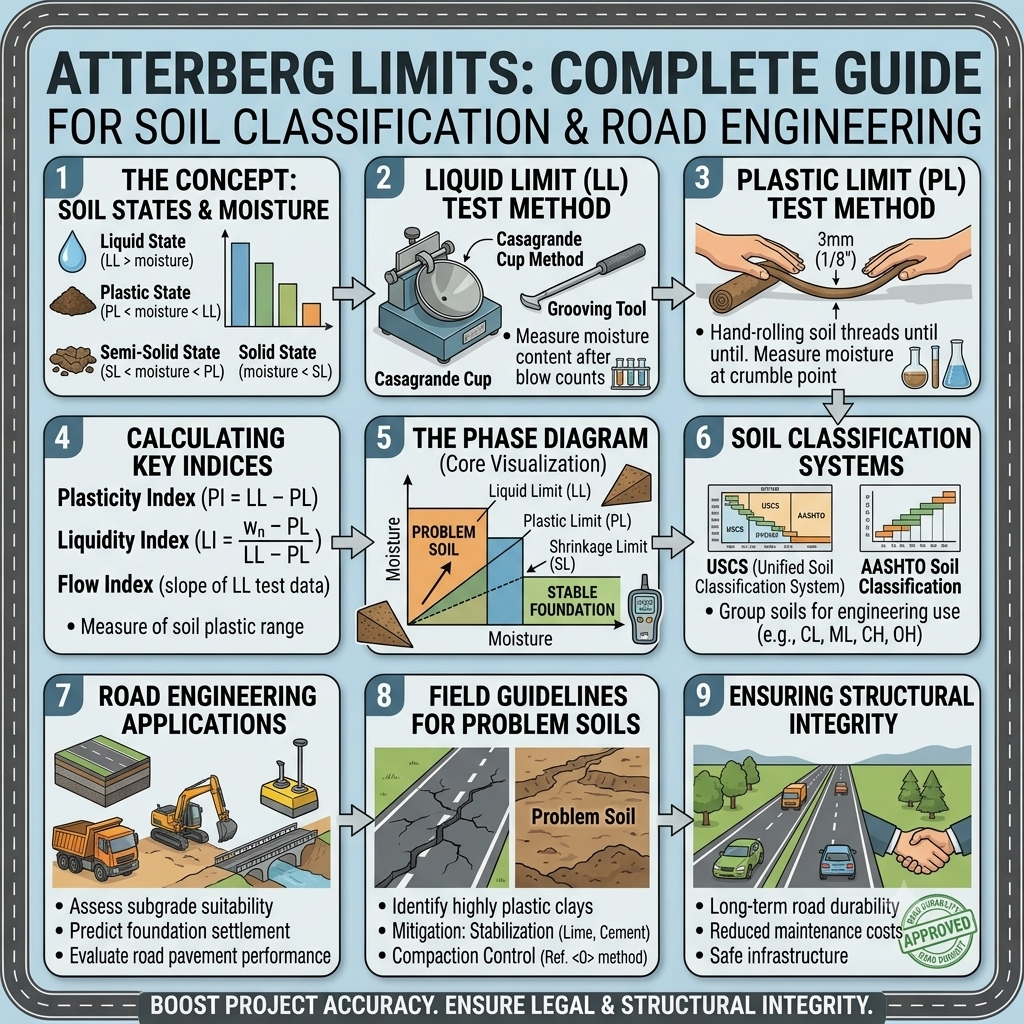
Soil State Diagram
The following simplified diagram illustrates how soil changes as its moisture content increases.
                   Increasing Water Content
────────────────────────────────────────────────────────►

SOLID
   │
   │  Shrinkage Limit (SL)
   ▼
SEMI-SOLID
   │
   │  Plastic Limit (PL)
   ▼
PLASTIC
   │
   │  Liquid Limit (LL)
   ▼
LIQUID
This progression helps engineers understand the consistency changes that occur in fine-grained soils under varying environmental conditions.
Practical Engineering Example
A highway project requires the construction of an embankment over clayey soil. Laboratory testing produces the following results:
- Liquid Limit (LL): 58%
- Plastic Limit (PL): 28%
Plasticity Index:
PI = 58 − 28 = 30%
A Plasticity Index of 30% indicates highly plastic soil with a significant potential for swelling and shrinkage.
Recommended Engineering Measures
- Stabilize the soil using lime or cement.
- Improve site drainage.
- Compact the soil near its optimum moisture content.
- Increase pavement thickness if required.
- Conduct additional CBR and compaction tests before construction.
These measures help improve subgrade strength and reduce the risk of pavement distress.
Key Takeaways
Atterberg Limits provide a simple yet powerful method for understanding the engineering behavior of fine-grained soils. By identifying the Liquid Limit, Plastic Limit, and Shrinkage Limit, engineers can evaluate soil consistency, classify materials, predict shrink-swell behavior, and make informed decisions during pavement and foundation design. The Plasticity Index further enhances soil assessment by measuring the range over which a soil remains workable. Mastering these concepts enables engineers, contractors, and students to select appropriate construction techniques, improve subgrade performance, and build safer, longer-lasting transportation infrastructure.
Laboratory Tests for Atterberg Limits
Engineers determine Atterberg Limits through standardized laboratory tests conducted on fine-grained soils. These tests require careful sample preparation and precise moisture measurements to ensure reliable results.
1. Liquid Limit Test
The Liquid Limit test identifies the moisture content at which soil changes from a plastic state to a liquid state.
Common Test Methods
- Casagrande Cup Method
- Cone Penetrometer Method
Basic Procedure
- Air-dry the soil sample.
- Remove particles larger than the specified sieve size.
- Mix the soil with clean water.
- Place the sample in the testing device.
- Record the moisture content at the specified condition.
- Calculate the Liquid Limit from the laboratory results.
Good Laboratory Practices
- Use a representative soil sample.
- Maintain consistent testing conditions.
- Calibrate equipment regularly.
- Repeat the test when results vary significantly.
2. Plastic Limit Test
The Plastic Limit test determines the moisture content at which soil begins to crumble while being rolled into thin threads.
Procedure
- Prepare the soil sample.
- Add water gradually.
- Roll the soil by hand into threads approximately 3 mm in diameter.
- Continue rolling until the thread crumbles.
- Determine the moisture content of the crumbled sample.
Engineering Importance
The Plastic Limit helps engineers evaluate:
- Soil workability
- Compaction behavior
- Construction suitability
- Plasticity characteristics
3. Shrinkage Limit Test
The Shrinkage Limit test identifies the moisture content below which additional drying no longer reduces soil volume.
Test Procedure
- Fill a shrinkage dish with saturated soil.
- Measure the initial volume.
- Allow the sample to dry completely.
- Measure the final volume.
- Calculate the Shrinkage Limit.
Engineering Benefits
The Shrinkage Limit assists engineers in evaluating:
- Volume stability
- Crack potential
- Foundation performance
- Pavement durability
Factors Affecting Atterberg Limits
Several factors influence the Atterberg Limits of fine-grained soils. Understanding these variables helps engineers interpret laboratory results more accurately.
1. Clay Mineral Type
Different clay minerals exhibit different plasticity characteristics.
For example:
- Montmorillonite generally shows very high plasticity.
- Illite exhibits moderate plasticity.
- Kaolinite usually has lower plasticity.
2. Clay Content
An increase in clay content generally increases:
- Liquid Limit
- Plastic Limit
- Plasticity Index
3. Organic Matter
Organic soils often display unusual consistency characteristics and reduced engineering strength.
4. Soil Structure
Particle arrangement influences moisture movement and consistency behavior.
5. Pore Water Chemistry
Dissolved salts and chemical composition affect the interaction between clay particles and water.
6. Weathering
Weathering changes soil mineralogy and often alters plasticity characteristics over time.
Engineering Applications of Atterberg Limits
Atterberg Limits play a vital role in almost every stage of geotechnical and highway engineering.
1. Highway Pavement Design
Road engineers evaluate subgrade quality before selecting pavement thickness.
Highly plastic soils often require:
- Soil stabilization
- Improved drainage
- Increased pavement thickness
- Geosynthetic reinforcement
2. Foundation Engineering
Engineers assess soil consistency before designing:
- Shallow foundations
- Deep foundations
- Raft foundations
- Retaining walls
3. Earth Embankments
Atterberg Limits help determine whether borrow materials are suitable for embankment construction.
4. Slope Stability
Plastic soils may lose strength after rainfall.
Engineers use Atterberg Limits when evaluating slope performance and landslide risks.
5. Dam Engineering
Engineers assess core materials for earth dams using plasticity characteristics to minimize seepage and cracking.
6. Soil Stabilization
Laboratory results help determine whether lime, cement, fly ash, or other stabilizing agents should improve soil properties.
Soil Classification Using Atterberg Limits
Atterberg Limits form an important part of engineering soil classification systems.
Unified Soil Classification System (USCS)
USCS combines:
- Grain size distribution
- Liquid Limit
- Plasticity Index
to classify soils into groups such as:
- CL – Lean Clay
- CH – Fat Clay
- ML – Silt
- MH – Elastic Silt
AASHTO Soil Classification
Highway engineers also use Atterberg Limits to classify subgrade soils for pavement design.
Higher Plasticity Index values generally indicate lower-quality subgrade materials that require special treatment.
Best Practices for Accurate Results
- Collect representative soil samples.
- Prevent contamination during sampling.
- Follow standardized laboratory procedures.
- Maintain equipment calibration.
- Repeat questionable tests.
- Record observations carefully.
- Compare laboratory results with field conditions.
- Use Atterberg Limits alongside CBR, compaction, and grain size analyses for comprehensive soil evaluation.
Practical Recommendations
Civil Engineers
- Never rely on Atterberg Limits alone when designing pavements or foundations.
- Review geotechnical reports thoroughly before finalizing designs.
- Consider seasonal moisture variations during design.
- Combine laboratory results with field investigations.
Contractors
- Verify soil quality before construction.
- Avoid placing highly plastic soils in critical structural layers.
- Maintain proper moisture during compaction.
- Follow project specifications for soil replacement or stabilization.
Engineering Students
- Understand the relationship between moisture content and soil behavior.
- Practice calculating the Plasticity Index.
- Learn laboratory procedures through hands-on testing.
- Interpret laboratory reports rather than memorizing values.
Common Mistakes to Avoid
- Ignoring soil moisture variations.
- Using disturbed or contaminated samples.
- Performing laboratory tests incorrectly.
- Selecting construction materials based only on appearance.
- Ignoring high Plasticity Index values.
- Omitting field verification.
- Assuming all clay soils behave similarly.
- Using Atterberg Limits without supporting geotechnical tests.
General Discussion of IRC, AASHTO, and ICE Practices
Recognized engineering organizations such as the Indian Roads Congress (IRC), AASHTO, and the Institution of Civil Engineers (ICE) emphasize the importance of soil characterization during highway and infrastructure development.
Although project specifications vary, these organizations generally recommend:
- Conducting laboratory classification tests before pavement design.
- Evaluating subgrade strength together with Atterberg Limits and CBR values.
- Avoiding highly plastic soils in structural pavement layers unless stabilization measures are adopted.
- Following standardized testing procedures for reliable and repeatable results.
- Considering local climate, drainage, and expected traffic loading during design.
Applying these principles helps engineers design safer, more durable, and cost-effective transportation infrastructure.
Frequently Asked Questions (FAQs)
1. What are Atterberg Limits?
Atterberg Limits are moisture content boundaries that define the consistency changes of fine-grained soils from solid to semi-solid, plastic, and liquid states.
2. Why are Atterberg Limits important in road engineering?
They help engineers classify soils, assess subgrade quality, predict shrink-swell behavior, and design durable pavement structures.
3. What is the difference between Liquid Limit and Plastic Limit?
The Liquid Limit marks the transition from plastic to liquid behavior, while the Plastic Limit marks the transition from semi-solid to plastic behavior.
4. How is the Plasticity Index calculated?
The Plasticity Index equals the Liquid Limit minus the Plastic Limit.
PI = LL − PL
5. Which soils require Atterberg Limit testing?
Fine-grained soils such as clay and silt typically require Atterberg Limit testing because their engineering behavior changes significantly with moisture.
6. Can Atterberg Limits predict soil strength?
They provide valuable information about soil consistency and engineering behavior, but engineers should combine them with strength tests such as the California Bearing Ratio (CBR) and shear strength tests.
7. What does a high Plasticity Index indicate?
A high Plasticity Index generally indicates greater swelling potential, increased shrinkage, higher compressibility, and lower performance under wet conditions.
8. Which laboratory equipment is commonly used for Liquid Limit testing?
Engineers commonly use the Casagrande Liquid Limit device or the Cone Penetrometer, depending on the applicable testing standard.
9. Can sandy soils have Atterberg Limits?
Clean sands are generally non-plastic and therefore do not exhibit meaningful Atterberg Limits.
10. Are Atterberg Limits sufficient for pavement design?
No. Engineers should evaluate Atterberg Limits together with grain size distribution, compaction characteristics, CBR values, drainage conditions, and traffic loading.
Conclusion
Atterberg Limits remain one of the most important tools for understanding the engineering behavior of fine-grained soils. By measuring the Liquid Limit, Plastic Limit, Shrinkage Limit, and Plasticity Index, engineers can classify soils, evaluate moisture sensitivity, and predict how a soil will perform under changing environmental conditions. These laboratory tests support critical decisions in highway engineering, pavement design, foundation construction, embankment development, and slope stability analysis. When engineers combine Atterberg Limits with geotechnical investigations, compaction testing, grain size analysis, and CBR evaluations, they gain a complete understanding of soil performance and can design safer, more durable infrastructure. Civil engineers, contractors, and students who understand these principles can select appropriate construction methods, reduce project risks, improve pavement longevity, and optimize maintenance costs. Applying standardized testing procedures and following recognized engineering practices ensures reliable results and contributes to the successful delivery of high-quality transportation and infrastructure projects.
